

VPS plan
ZAP Spark
€7.29/ 30 days
- 4 GB RAM
- 2 CPU
- 60 GB NVMe
- 1 Gbit/s Uplink
You decide which services we may enable for analytics, personalization, and external content.
We use cookies and similar technologies on our website to personalize content, embed external media, and better understand how individual areas are used.
Necessary cookies
These entries support essential functions such as security, stability, and form processing.
Optional sections
Your data may be processed with your consent or on the basis of legitimate interests. In the cookie settings, you can reject or explicitly allow each optional category.
Some services process personal data in third countries. By consenting, you also agree to this transfer. You can find more information in our Privacy Policy.
You can reopen and change your selection at any time. · 1.0.2
 Self-hosted OpenObserve
Logs, metrics and traces on your server: 1-click Coolify install, root access, DDoS protection and locations in Europe & America.
Packages 1–3 of 9
OpenobserveConfigure yourself
No package fits? Choose your CPU, RAM and storage—you only pay for what your project actually needs.
Powerful CPUs
100 Gbit/s host network
Juniper Firewall
DDoS protection
 Visa
 Mastercard
 American Express
 PayPal
 Google Pay
 Apple Pay
 Klarna
 Amazon Pay
What is OpenObserve?
When a deploy breaks checkout at 2 a.m., OpenObserve shows you the error log, the latency spike and the slow span in one place instead of three separate tools. It is an open source observability platform for logs, metrics and traces, with SQL and PromQL queries, dashboards and alerts. On your own VPS, the Coolify app installer deploys it in one click, so your telemetry lands on a server you control right away.
Full root and SSH access means you decide how OpenObserve runs. You can set retention, run an OpenTelemetry Collector or Grafana next to it via Coolify, restrict ingest endpoints with your own firewall and keep every log line on the disk in the location you picked. Unlike a managed platform or a usage-billed SaaS, nothing leaves the server unless you send it, and you can inspect containers, volumes and configs directly.

Features
Search logs with SQL, follow a request across services as a trace and get alerted on error spikes, all from one self-hosted interface.
OpenObserve runs on your VPS without you writing a compose file yourself.
Find the one failing request fast, across all services and time ranges.
Watch CPU, latency and custom metrics side by side on shared dashboards.
See which service slowed a request down, span by span, via OpenTelemetry.
Hear about error spikes before your users do, via email or webhook destinations.
Answer ad-hoc questions about your telemetry with query languages you already know.
Locations in Europe and America
4 data centers in Europe and America — choose the location closest to your users.

Inside OpenObserve
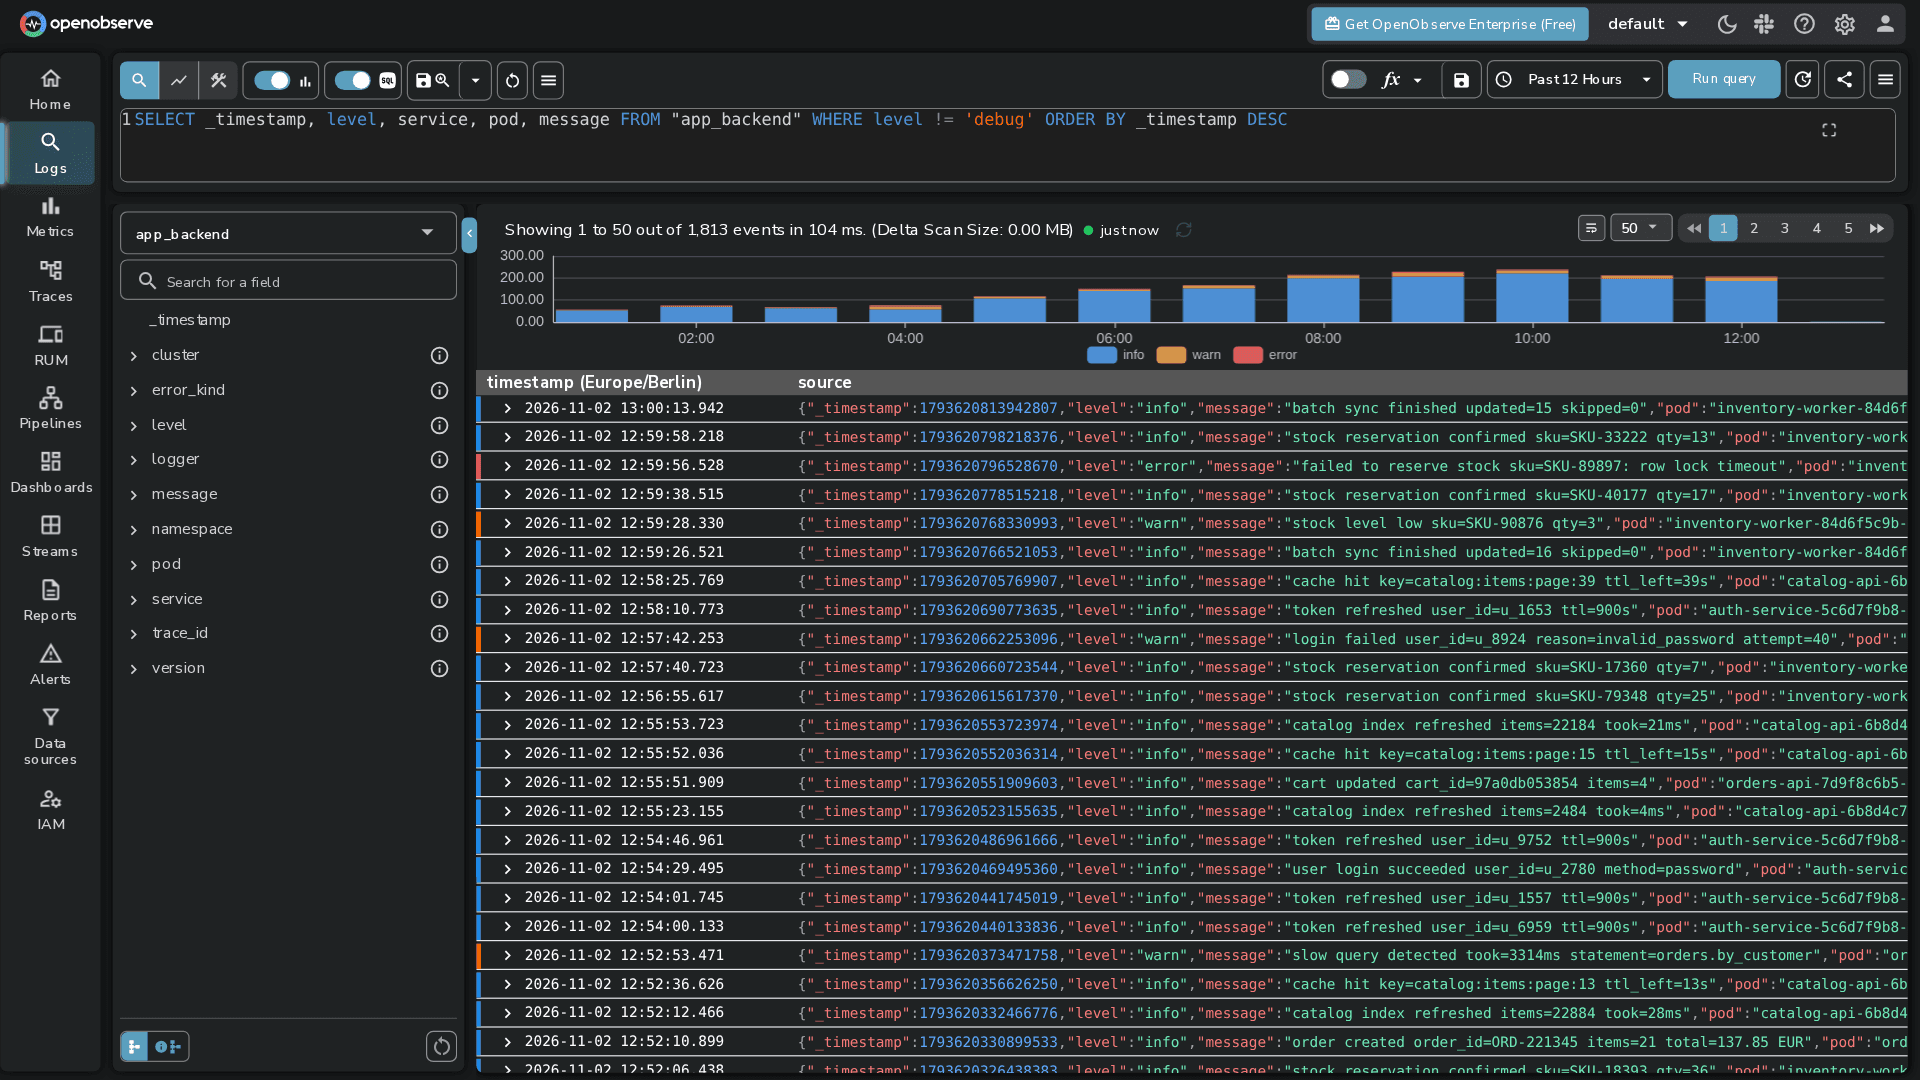
Tail live logs, chart metrics, open a trace as a flamegraph and replay the user session behind an error, all in one browser UI.
Openobserve
Openobserve
Live log stream
Follow logs from every service as they arrive. Each line shows timestamp, severity and source, and expands into the full structured record when you need the details.
Get started now
Openobserve on your VPS in minutes — no complicated setup.
Backups & snapshots
Snapshots let you roll back quickly. ZapX Pass unlocks Restore, manual Backups, and longer retention for daily Backups.
More control with ZapX Passextra storage, restore, Pass perks, and Lifetime VPS without activity checks
Reviews
Real feedback on support and setup.
FAQ
Answers to the most important questions before you start.
It is OpenObserve, the open source platform for logs, metrics and traces, installed via the Coolify app installer on your own KVM VPS. You choose from our VPS plans, keep full root access, and your data stays on your server's disk in the location you pick.
You pay for the VPS plan, not a per-GB ingestion bill. OpenObserve itself is open source, so your cost depends on the VPS plan, term and location you choose. Current prices load live in the pricing section, and terms of 90, 180 or 365 days come with a discount. You can cancel anytime.
It depends on how much data you ingest per day and how long you keep it. A small plan suits a homelab or a handful of services. Production stacks with many services, traces and longer retention need more RAM, CPU cores and disk. Start with what you need today and move to a larger plan as your volume grows.
Order a VPS, open One-Click Apps in the panel and pick OpenObserve from the Coolify app catalog. Coolify pulls the container and sets up persistent storage and a URL for the UI. Then log in with your admin account and copy the ingestion endpoints into your collectors. Read the One-Click Apps guide
Yes. You get root and SSH access to the whole VPS, so you can read container logs, change environment variables, tune retention or add your own tools. Coolify is optional: it makes deploys easier, but you can manage everything from the shell. First SSH access explained
Yes. OpenObserve accepts OTLP, so an OpenTelemetry Collector or SDK can ship logs, metrics and traces directly. It also takes data from agents such as Fluent Bit and Vector, and you can turn on syslog ingestion in the settings.
Yes, as long as your plan has enough resources. Coolify can deploy more apps on the same VPS, such as Grafana, an OpenTelemetry Collector or a reverse proxy, each in its own container. Learn more about Coolify
Your telemetry is stored on your VPS's own disk in the data center you choose. ZAP-Hosting has locations in Europe and America, so pick the one closest to your services or users. Ashburn, Dallas or Los Angeles, for example, are common choices for workloads running in North America.
Every VPS is DDoS-protected. On top of that, serve the UI over HTTPS through Coolify's proxy, use strong credentials for the admin user, and restrict the ingest endpoints to your collectors' IPs with a firewall. Set up the Linux firewall
Yes. Every VPS gets a daily automatic Backup, included in the price. With the ZapX Pass you can view and restore these daily Backups, create manual Backups and snapshots, and keep daily Backups for longer depending on your Pass tier.
Any more questions?
Contact SupportZAPX Dashboard
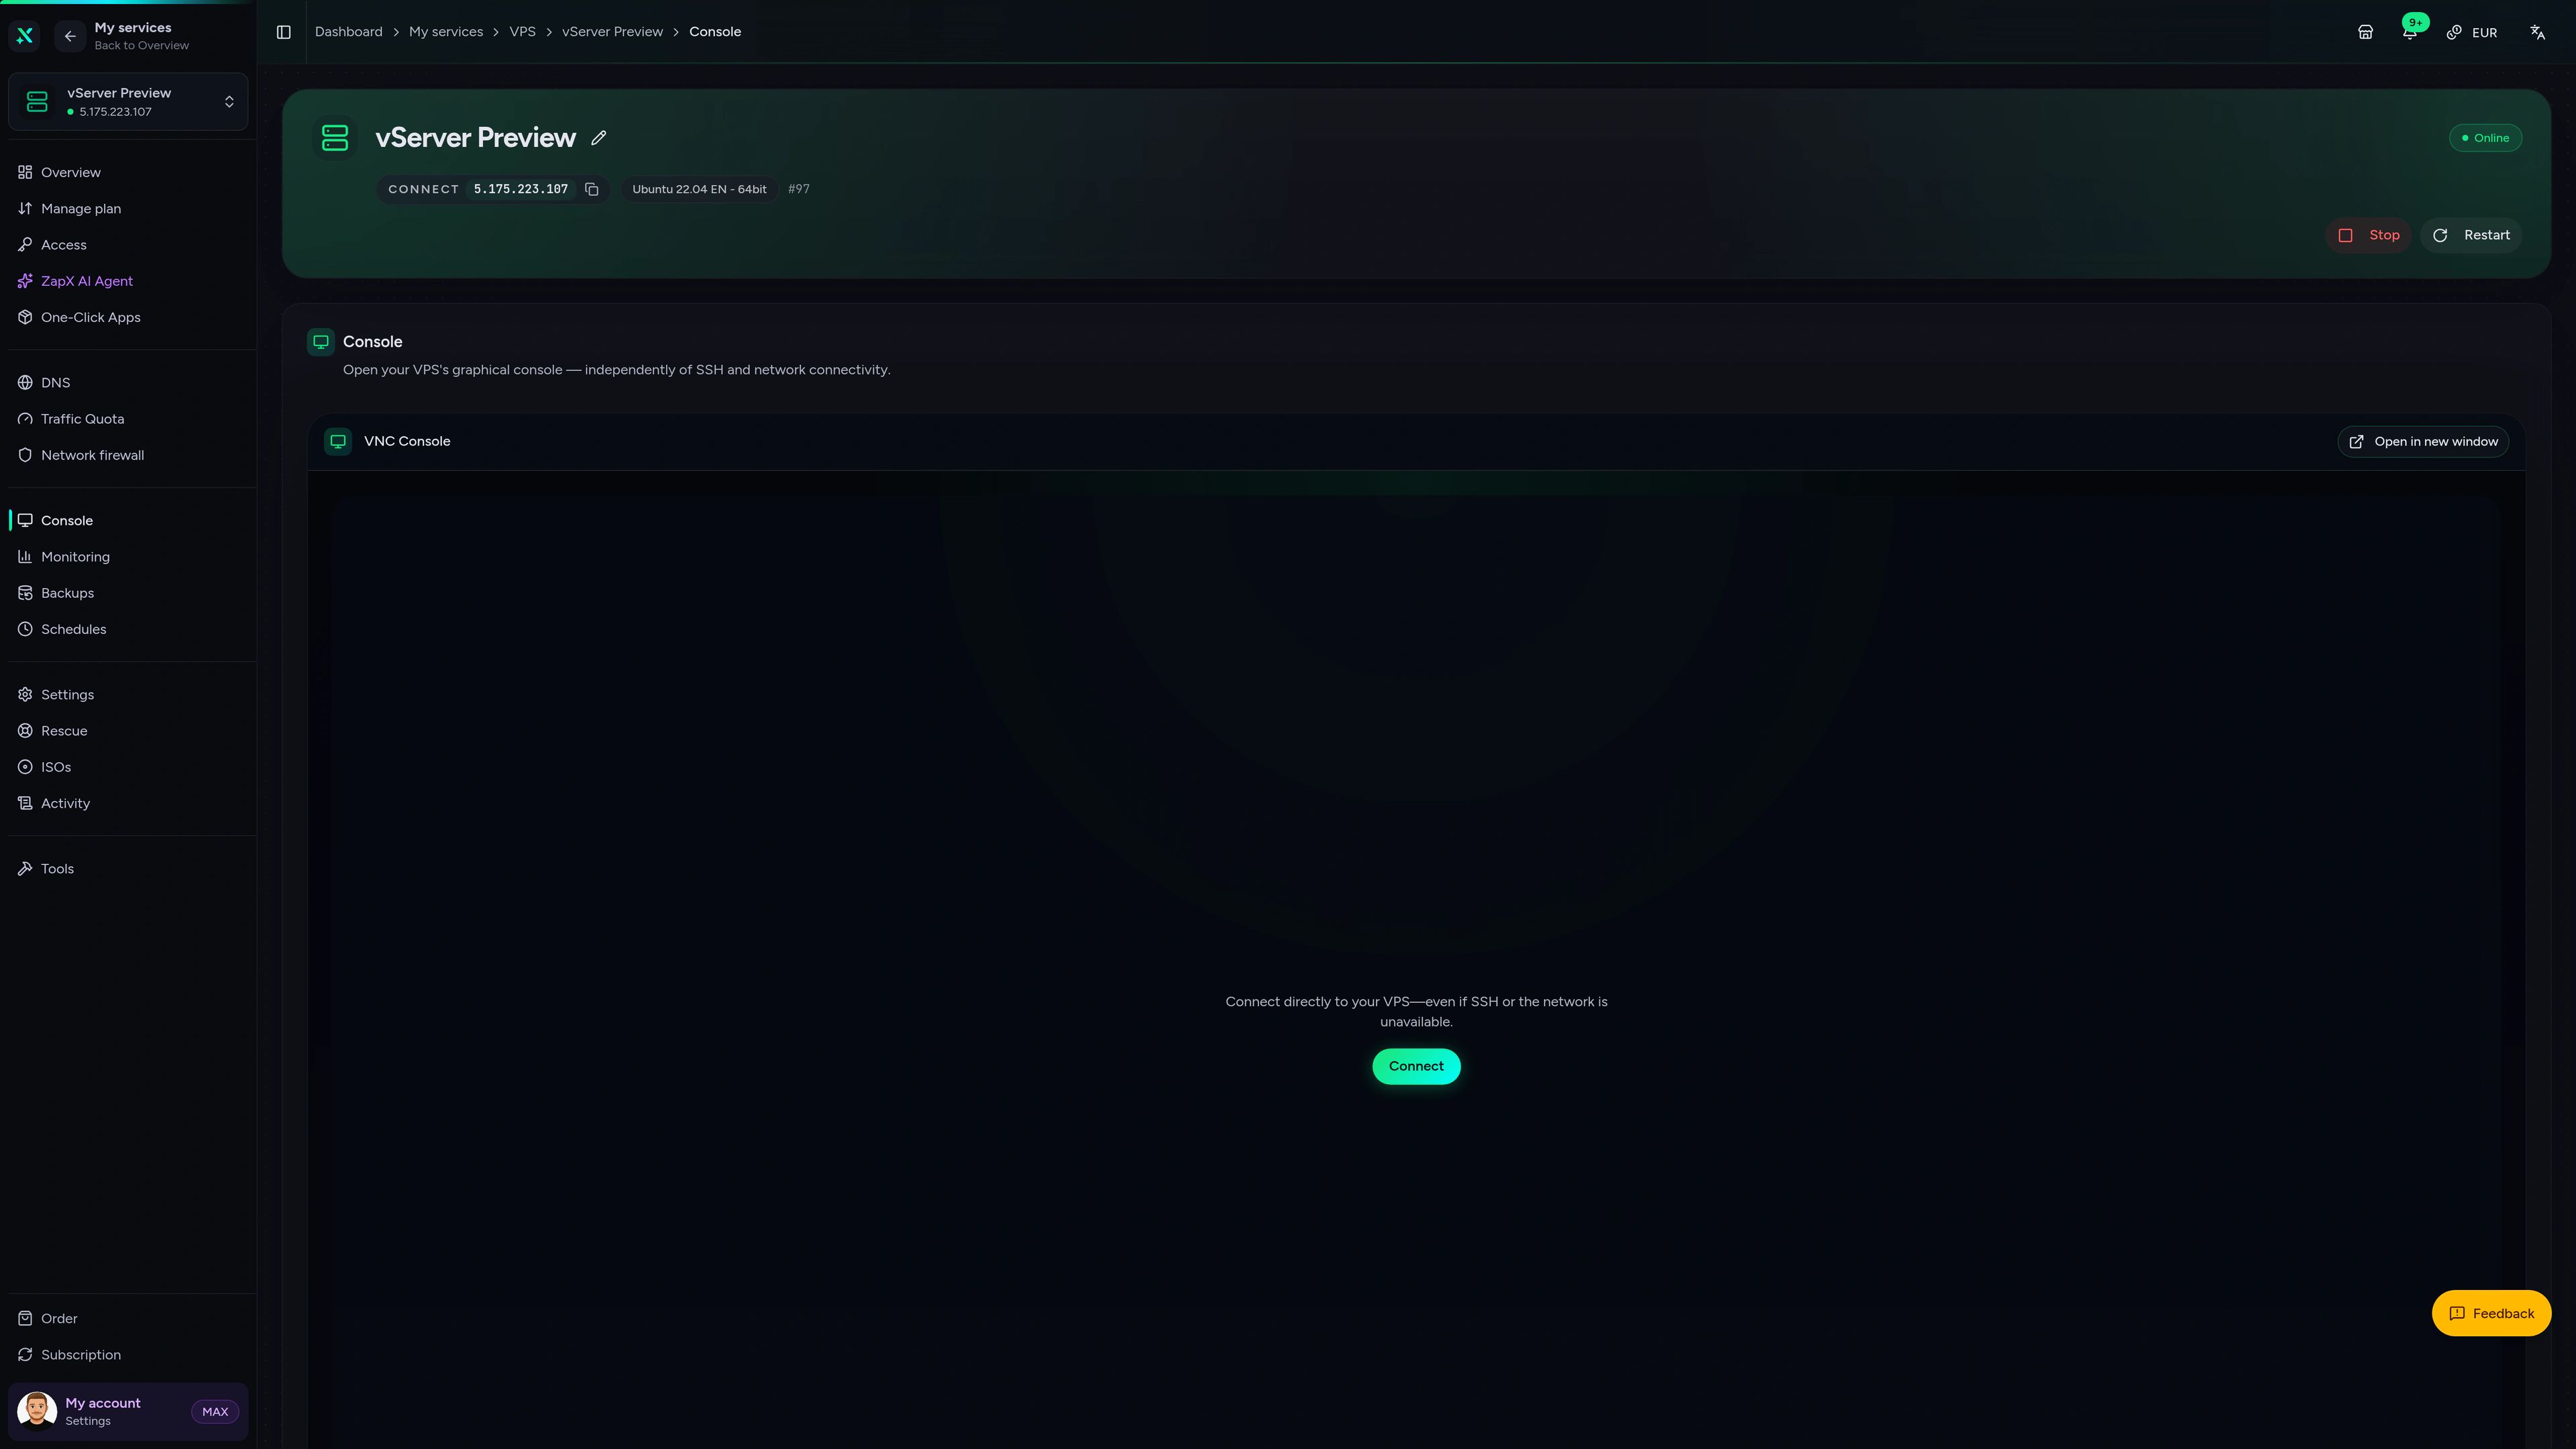
Check CPU, RAM and network load, open the console and restart the server from the ZapX panel.
VPS Console tab
VPS Console tab
The ZapX AI Agent knows your VPS context and helps with OpenObserve resource questions, ingestion errors and safe updates, right in the panel.
The ZapX AI Agent is part of the ZapX Pass and works account-wide across every supported service.
View ZapX PassZapX AI Agent
panel.zap-hosting.com
Performance
The numbers show how much headroom you have for steady ingestion, fast queries over large log ranges and dashboards that refresh while new data keeps arriving.
High-performance VPS, CPU model depends on the location
Typical VPS plans without a published host CPU
confirmed 2026-07-01
Use cases
From on-call incident response to release checks: real situations where OpenObserve on your own VPS gives teams faster answers about their systems.
Ready to self-host?
Start your OpenObserve VPS in one click
ZapX appComing soon
Check server status, resource load and term from the ZapX mobile app, wherever an alert reaches you.
Also available
WireGuard, Coolify, monitoring, and more — one-click setup on your VPS.

Private Cloud
NextCloud is a self-hosted, open-source platform that provides file storage, collaboration, and communication tools for seamless data management.
Automatic setup

automation
n8n is an extendable workflow automation tool.
Ready in ~2 min

vpn
The easiest way to run WireGuard VPN + Web-based Admin UI.
Ready in ~2 min

media
Plex organizes video, music and photos from personal media libraries and streams them to smart TVs, streaming boxes and mobile devices.
Ready in ~2 min

Password Security
Vaultwarden is a password manager that allows you to securely store and manage your passwords.
No manual configuration

cms
WordPress is open source software you can use to create a beautiful website, blog, or app.
Ready in ~2 min
Also available
WireGuard, Coolify, monitoring, and more — one-click setup on your VPS.
755
Available apps
Benefit
The app marketplace is included with your VPS — no extra charge per installation.
Choose your apps in the configurator and get started in minutes.
Deploy OpenObserve in one click, keep full root access and choose a location in Europe or America. Cancel anytime.
No setup. No risk. Online in 60 seconds.
© 2026 ZAP-Hosting GmbH
 Preferred source on Google