VPS plan
ZAP Spark
€7.29/ 30 days
- 4 GB RAM
- 2 CPU
- 60 GB NVMe
- 1 Gbit/s Uplink
You decide which services we may enable for analytics, personalization, and external content.
We use cookies and similar technologies on our website to personalize content, embed external media, and better understand how individual areas are used.
Necessary cookies
These entries support essential functions such as security, stability, and form processing.
Optional sections
Your data may be processed with your consent or on the basis of legitimate interests. In the cookie settings, you can reject or explicitly allow each optional category.
Some services process personal data in third countries. By consenting, you also agree to this transfer. You can find more information in our Privacy Policy.
You can reopen and change your selection at any time. · 1.0.2
 Self-hosted Grafana + PostgreSQL
Deploy Grafana with PostgreSQL in one click via Coolify, full root access, DDoS protection and locations in Europe & America.
Packages 1–3 of 9
Grafana with PostgreSQLConfigure yourself
No package fits? Choose your CPU, RAM and storage—you only pay for what your project actually needs.
Powerful CPUs
100 Gbit/s host network
Juniper Firewall
DDoS protection
 Visa
 Mastercard
 American Express
 PayPal
 Google Pay
 Apple Pay
 Klarna
 Amazon Pay
Your dashboards, your server
Grafana turns metrics, logs and database tables into live dashboards. You see CPU load across your servers, last night's error spike or today's signups at a glance, and an alert reaches you before users notice a problem. This template runs open-source Grafana on your own KVM VPS with PostgreSQL as its backend database, so users, dashboards and alert rules live in a real database server instead of the default SQLite file.
Once you activate Coolify in the One-Click Apps tab, it deploys Grafana and PostgreSQL together in one click, so you skip writing a docker-compose file, wiring the database and configuring HTTPS by hand. Root access stays with you: run Prometheus or Loki next to Grafana, install the plugins you need, point your own domain at the dashboards and keep all monitoring data on a server you control.

Why this setup fits Grafana
Live dashboards, SQL queries on your own data and alerts to your team, with PostgreSQL wired in as Grafana's database from the first click.
Both containers start already connected, so you never write a docker-compose file.
See the health of every monitored host on one screen, refreshed live.
Answer business questions straight from PostgreSQL or MySQL tables with plain SQL.
Metrics, logs and SQL tables come together on shared dashboards instead of separate tools.
Get notified by email, Slack or webhook the moment a threshold is crossed.
Track signups, orders or revenue as big numbers your whole team understands.
Locations in Europe and America
4 data centers in Europe and America — choose the location closest to your users.

Inside Grafana
Connect PostgreSQL and other data sources, write SQL right in the query editor and turn the results into dashboards and alert rules your whole team can use.
Grafana with PostgreSQL
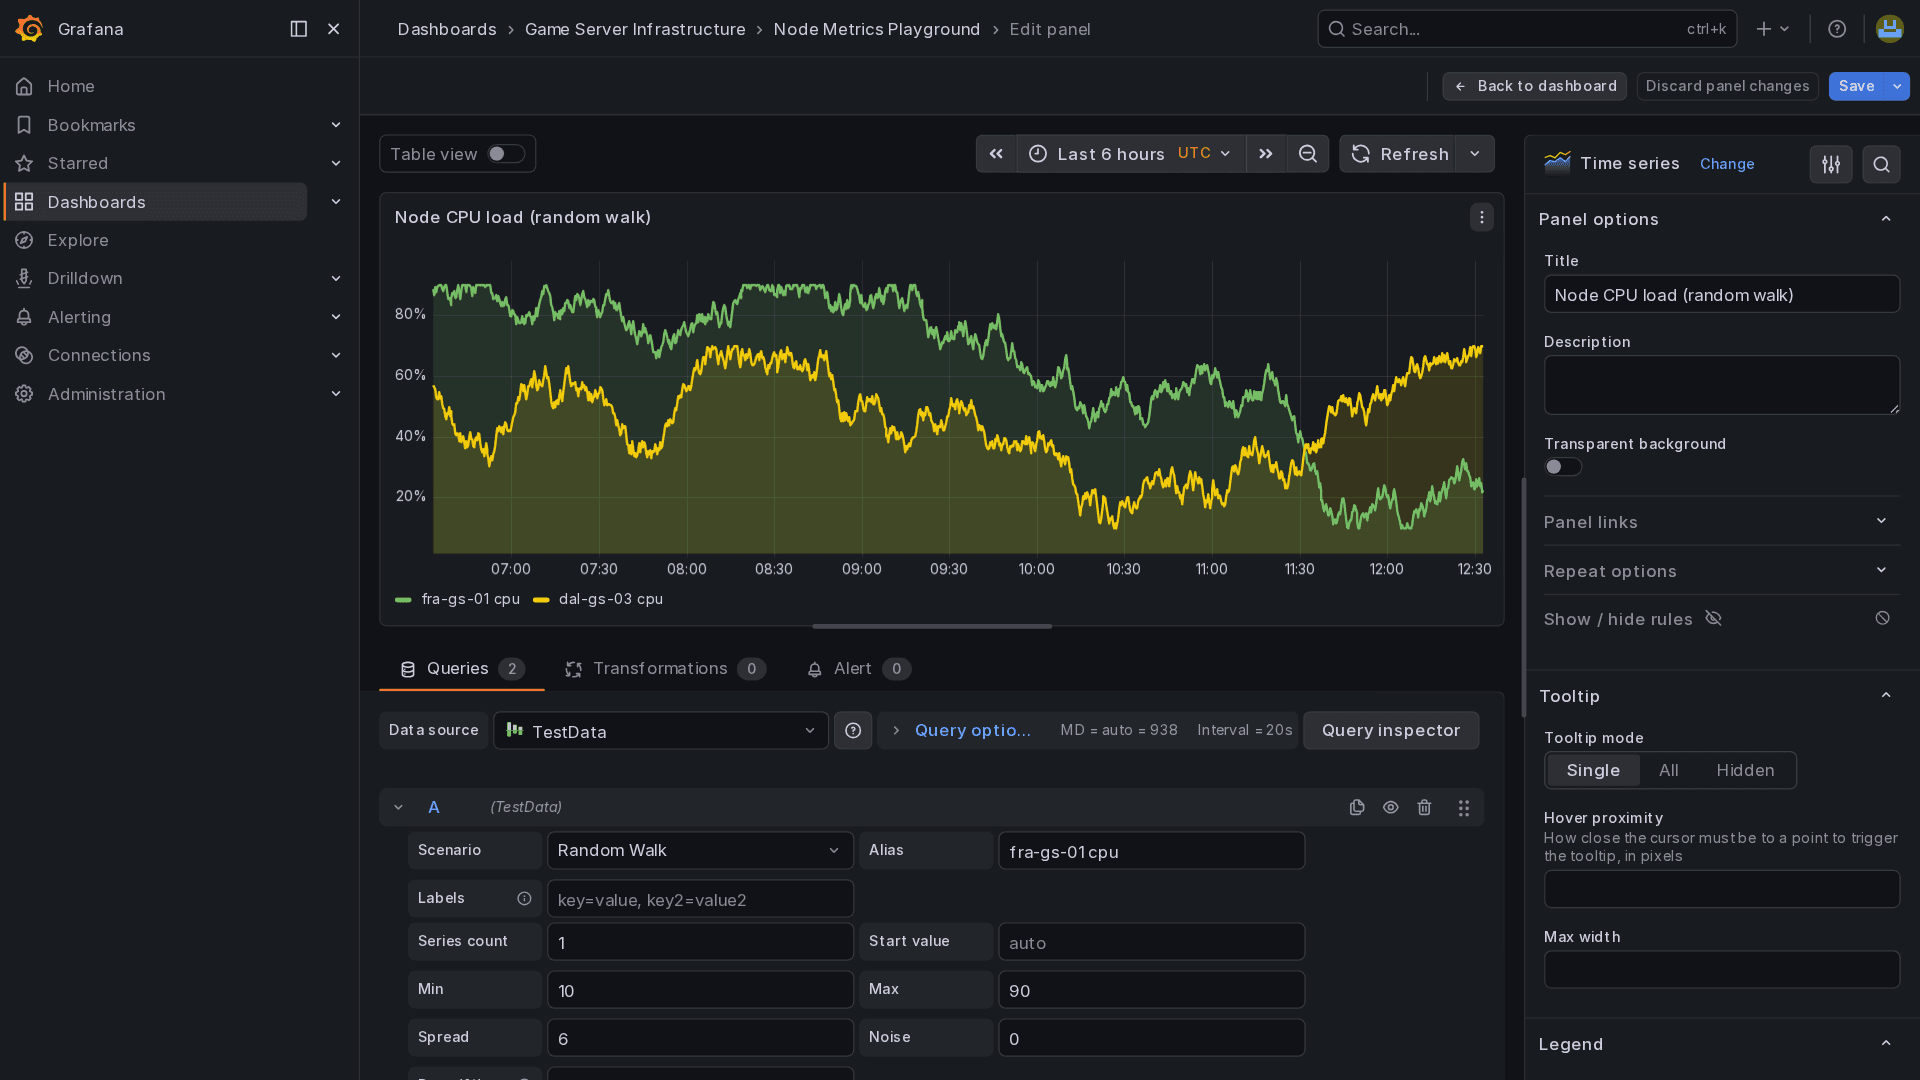
Grafana with PostgreSQL
PostgreSQL data source setup
Add PostgreSQL as a data source in a single form: pick the type, enter host, port, database and user, then test the connection before you save. Your business data is ready for dashboards in minutes.
Get started now
Grafana with PostgreSQL on your VPS in minutes — no complicated setup.
Backups & snapshots
Snapshots let you roll back quickly. ZapX Pass unlocks Restore, manual Backups, and longer retention for daily Backups.
More control with ZapX Passextra storage, restore, Pass perks, and Lifetime VPS without activity checks
Reviews
Real feedback on support and setup.
FAQ
Answers to the most important questions before you start.
Yes. Grafana OSS is open source and has no license fee, so self-hosting it costs only the server it runs on. With this template, your monthly cost is the price of the VPS package you choose. That is a fixed amount instead of billing per user, metric or log volume. Current package prices are shown live in the pricing section.
Order a VPS, open Coolify in the One-Click Apps tab and deploy the Grafana with PostgreSQL template in one click. Coolify starts both containers and connects Grafana to the database, and you keep full root and SSH access. To update Grafana later, redeploy the app in Coolify with a newer image version after dumping the PostgreSQL database with pg_dump. Read the One-Click Apps guide
Grafana alone needs little, but Coolify, PostgreSQL and Grafana share the same server. For a personal or small-team setup, start with a package that has at least 2 GB RAM and 2 vCPU cores. If you plan to run Prometheus, Loki or many dashboards on the same VPS, choose 4 GB RAM or more and extra storage. You can upgrade to a bigger package later.
Yes. Grafana ships with data sources for Prometheus, Loki, InfluxDB, MySQL, PostgreSQL and more, and plugins add others. Remote sources only need to be reachable from your VPS. The bundled PostgreSQL stores Grafana's own data; your business databases connect separately. Grafana and Prometheus are not alternatives: Prometheus collects and stores metrics, Grafana visualizes them, and both can run on the same VPS.
Yes, every VPS gets a daily automatic Backup, included even without ZapX Pass, and it covers Grafana and PostgreSQL too. ZapX Pass adds manual Backups, restores and snapshots. For extra safety, also dump the PostgreSQL database with pg_dump on a schedule and export important dashboards as JSON. Learn more about Backups
Yes. Create an A record that points your domain or subdomain to your VPS IP, then set it as the domain of the Grafana app in Coolify. Coolify's proxy requests the HTTPS certificate, so your team opens dashboards at an address like grafana.yourdomain.com. How to set DNS records
Yes. You can export dashboards as JSON and import them into the new instance, and you can recreate or provision your data source settings. To bring over users, folders, permissions and alert rules as well, migrate the old SQLite database to PostgreSQL with a migration tool before you switch. Test the result on the new VPS before you shut down the old server.
VPS servers are available at data center locations in Europe and America, including ZAP-Hosting's own sites. Pick the one closest to your team and the systems you monitor. Many North American teams start with Ashburn, Dallas or Los Angeles. You see the available locations when you configure your VPS.
Any more questions?
Contact SupportZAPX Dashboard
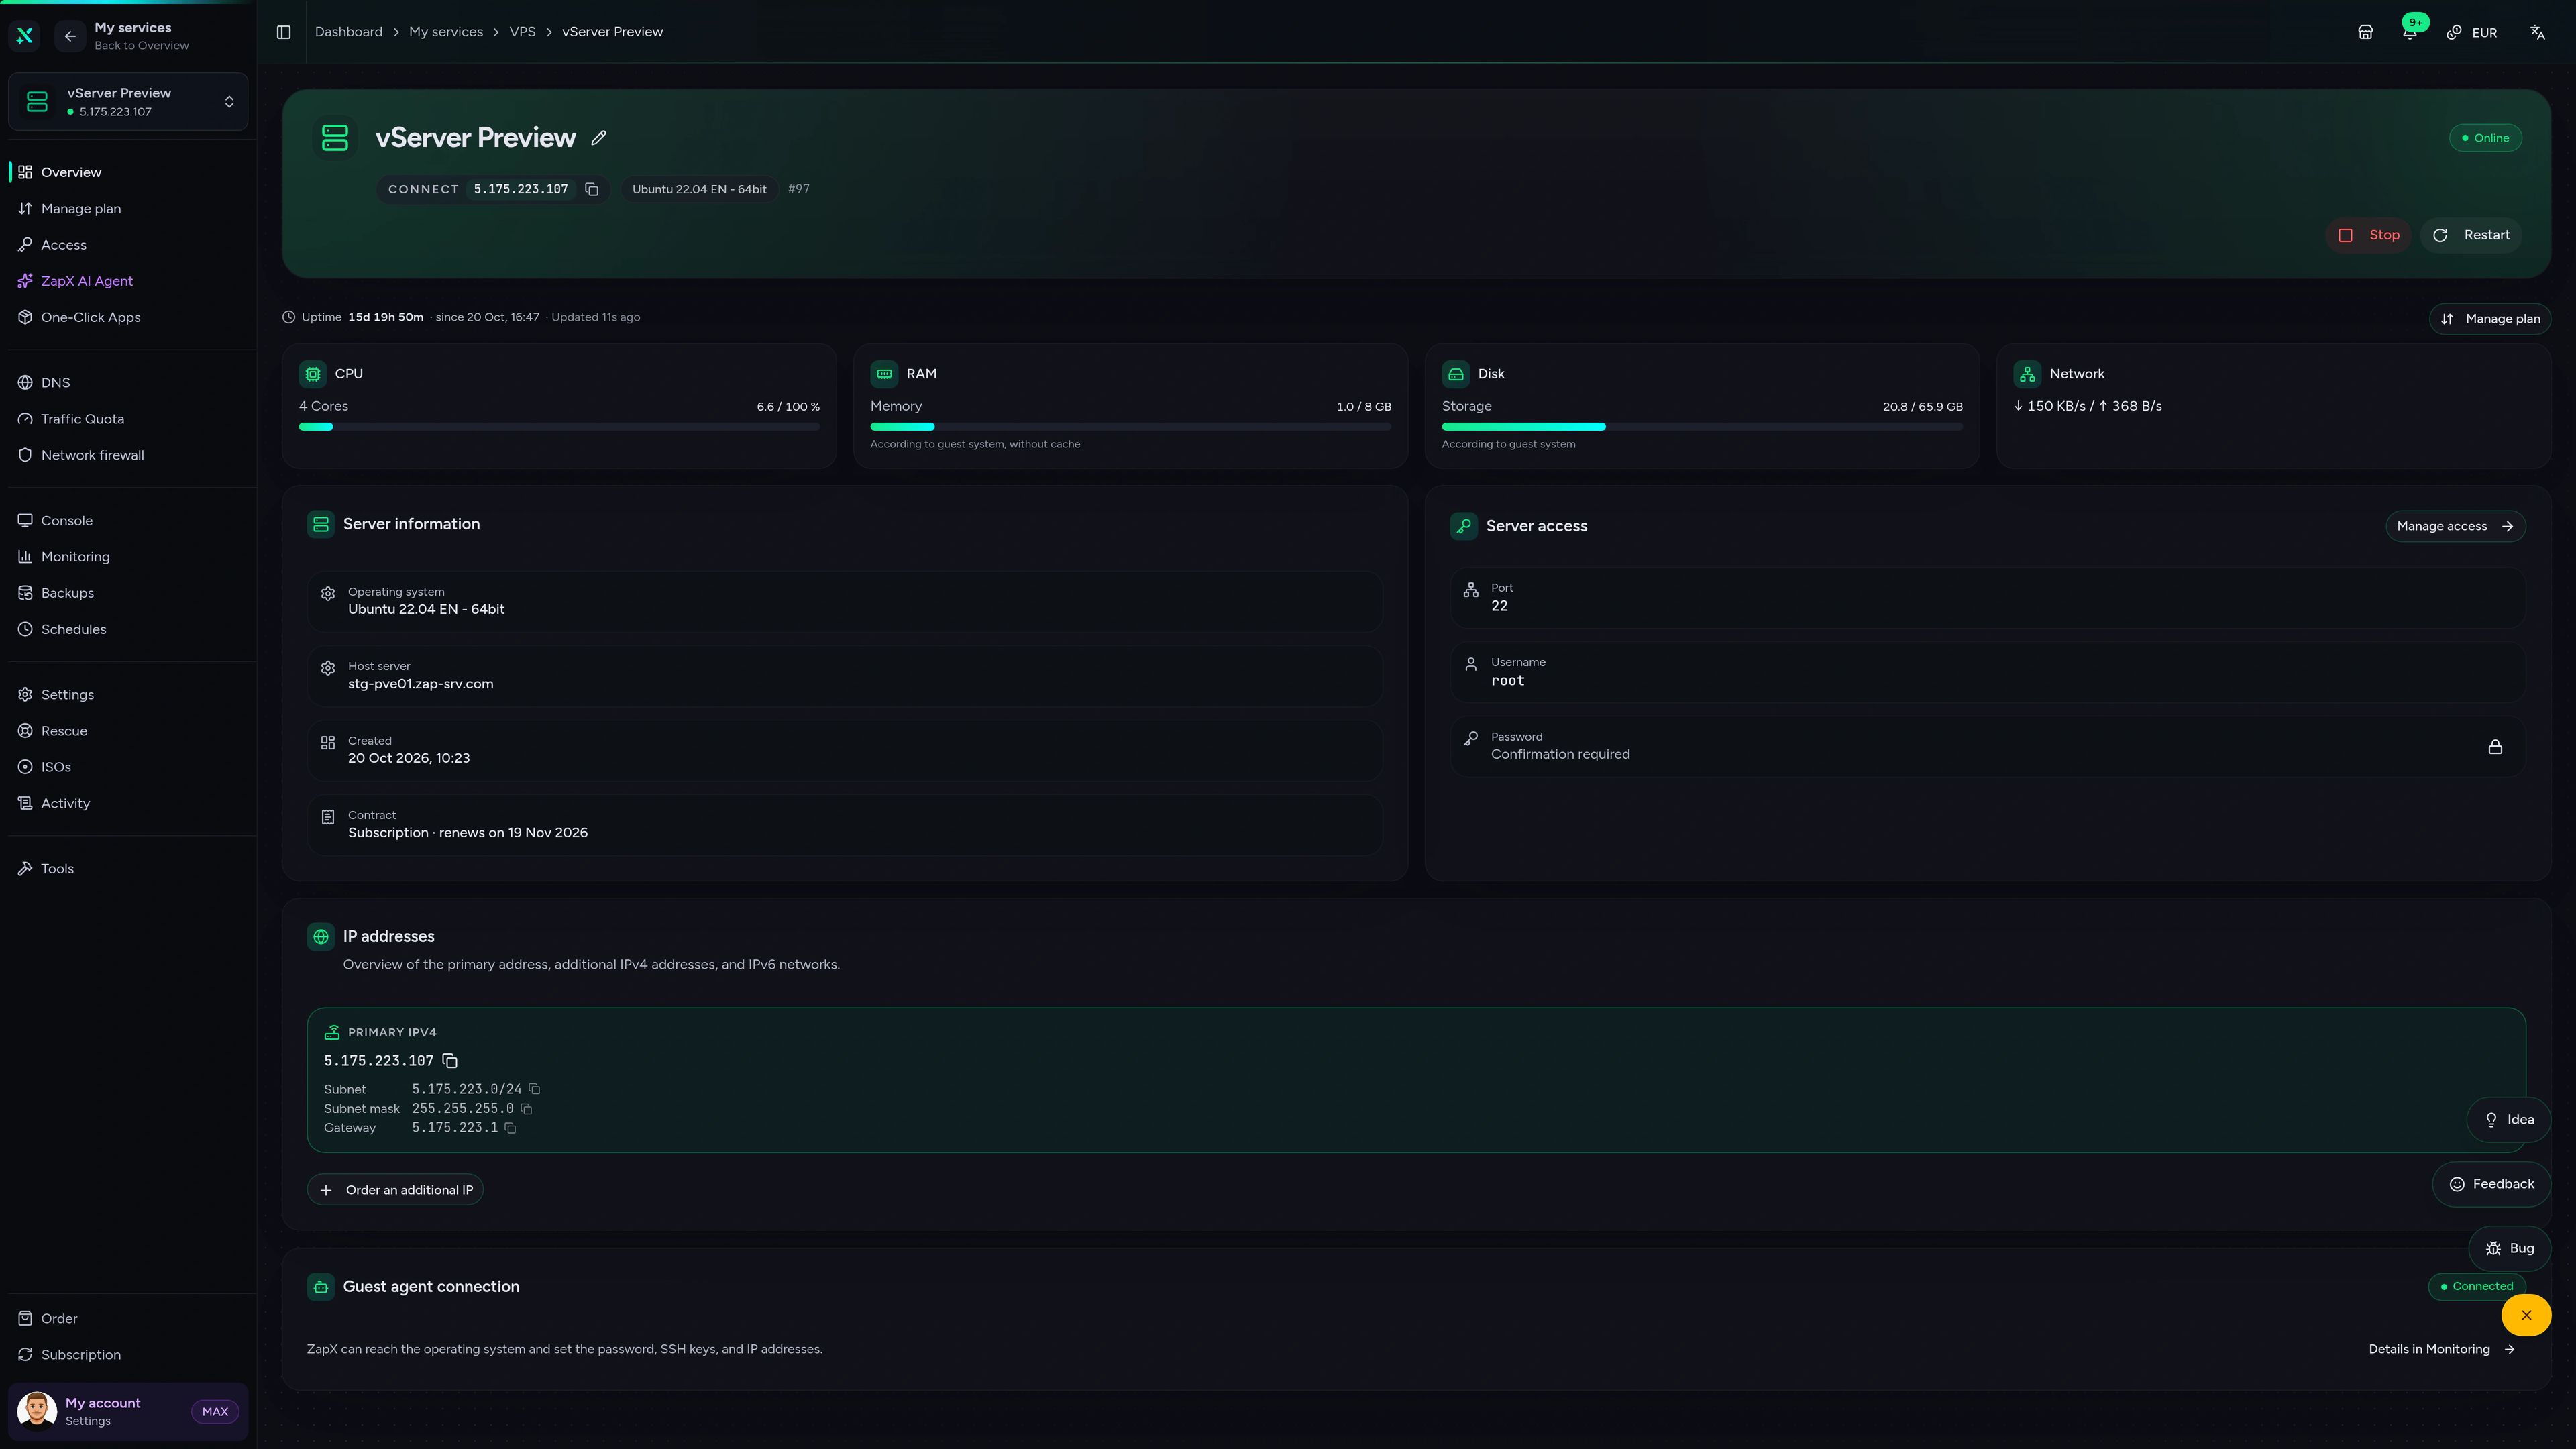
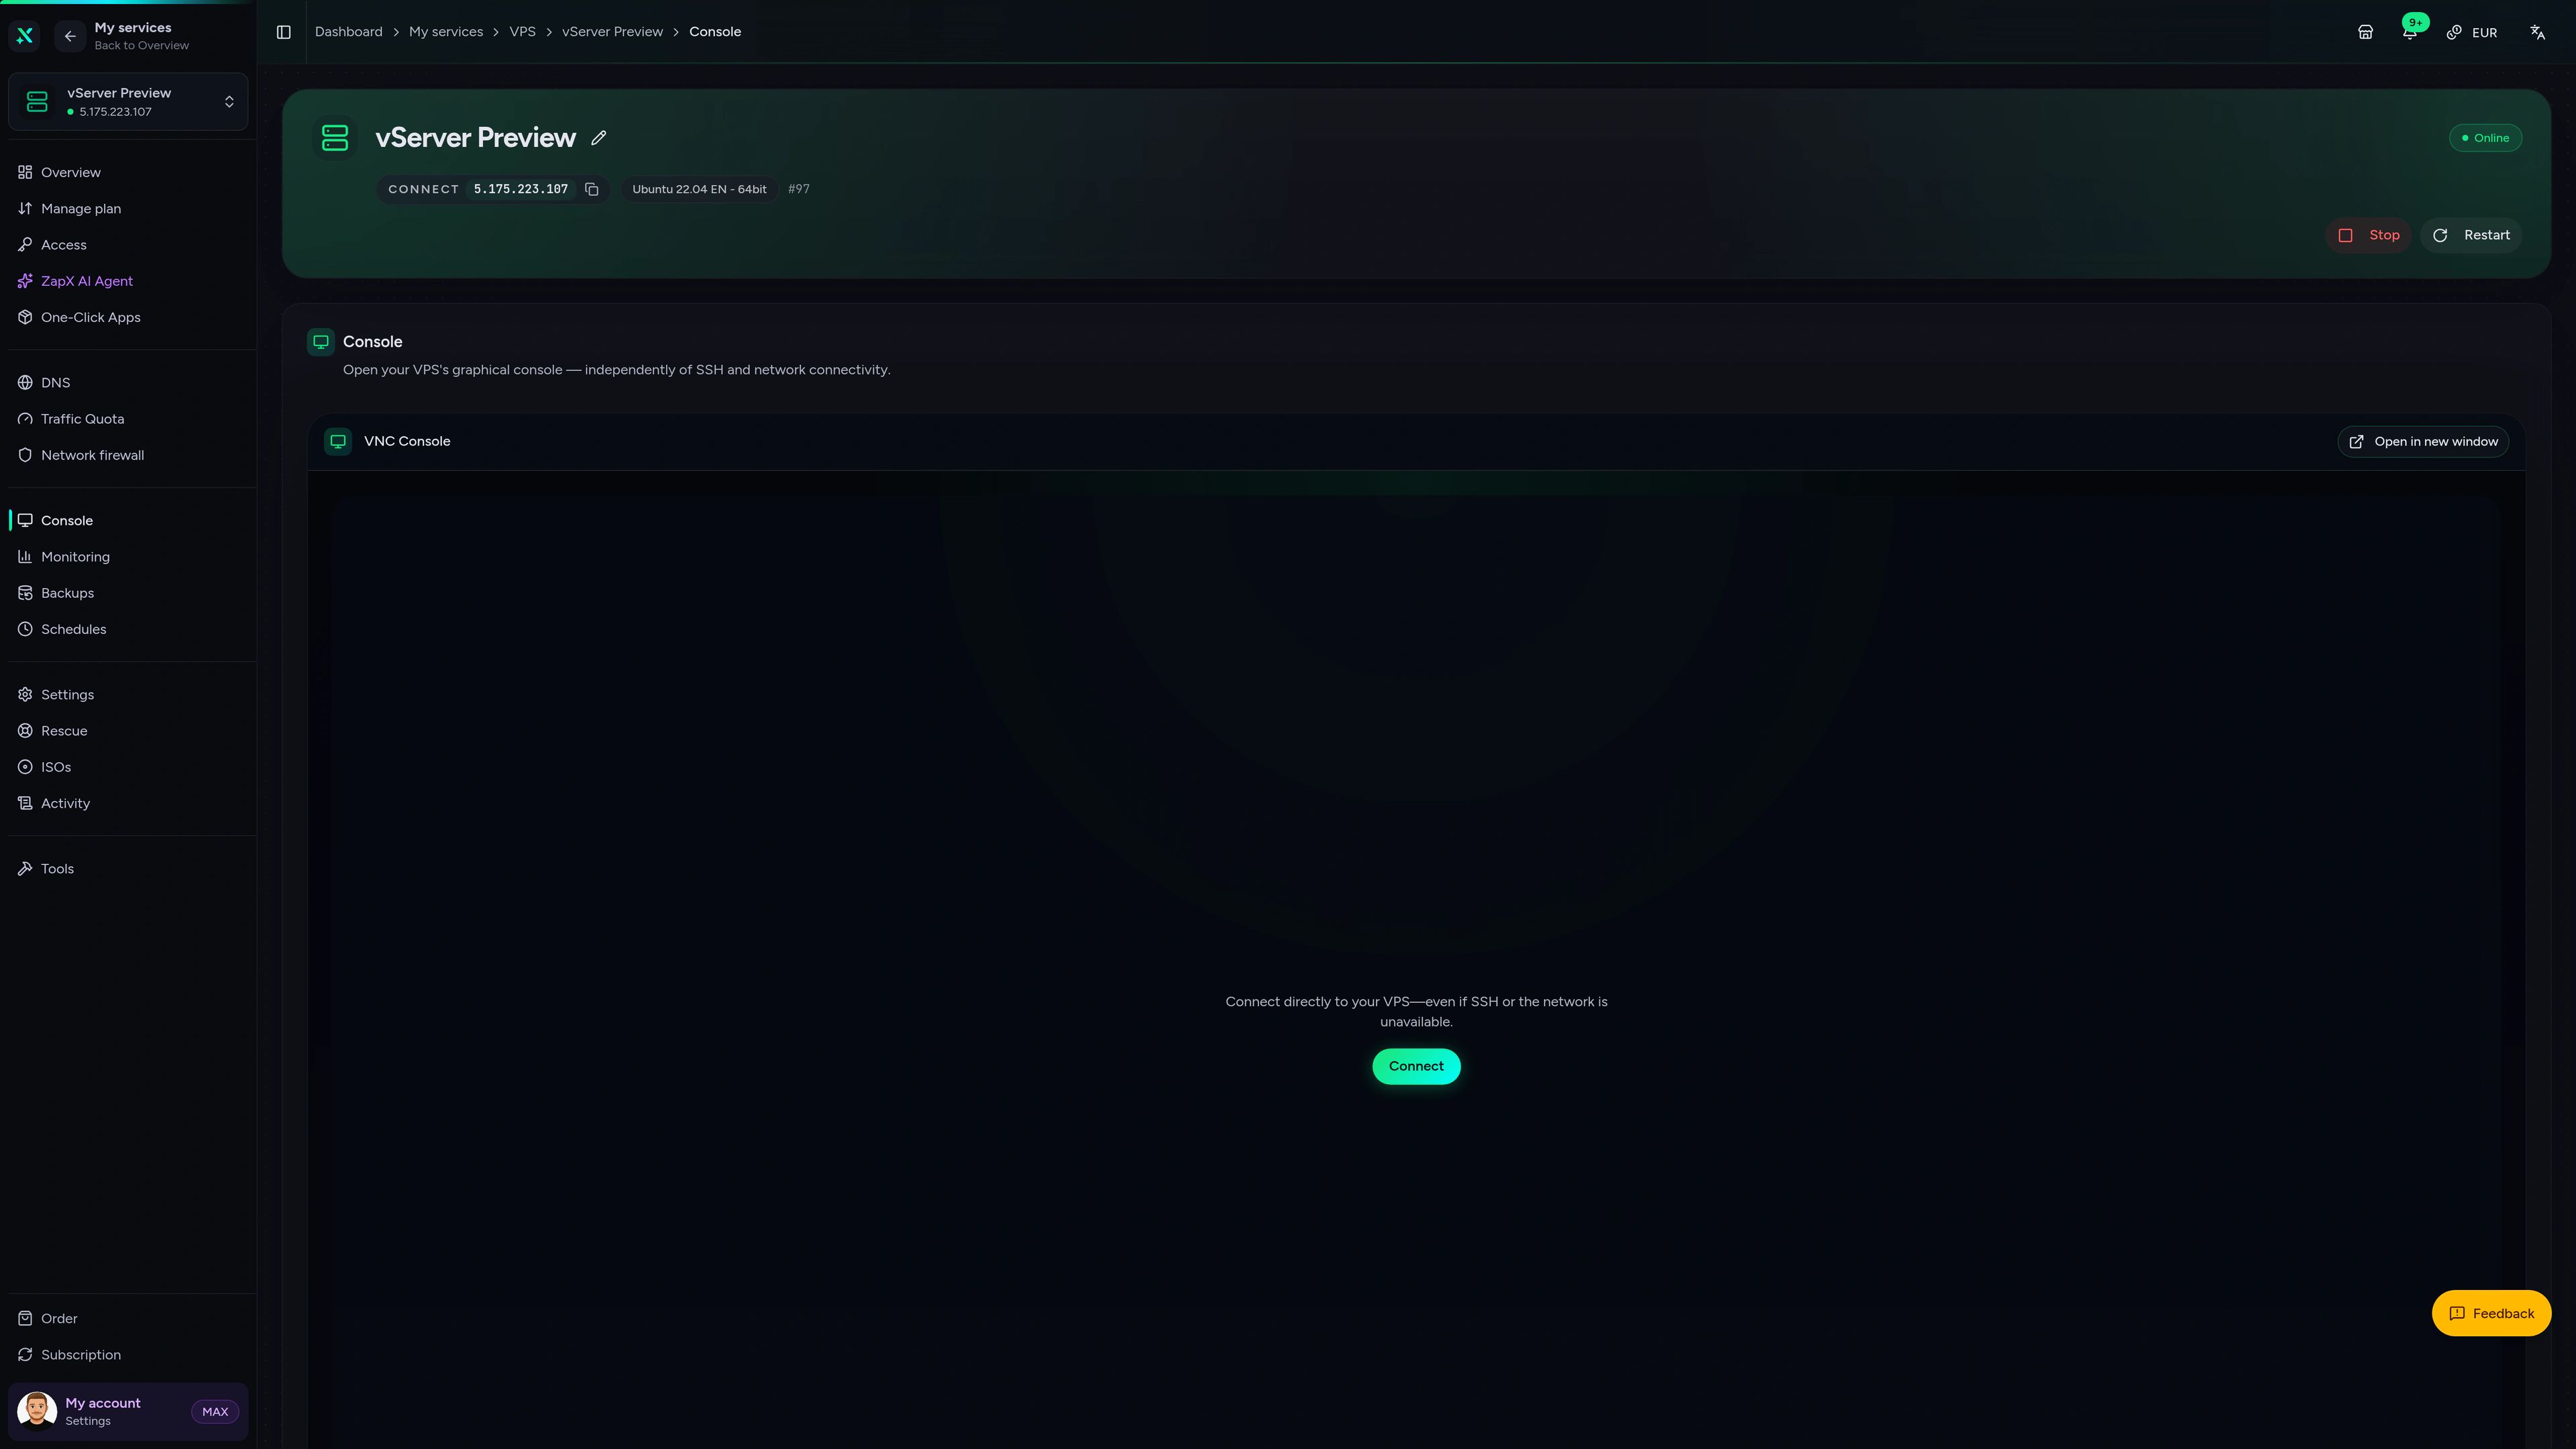
Keep resources, Backups and console access for the server behind your Grafana instance in one place.
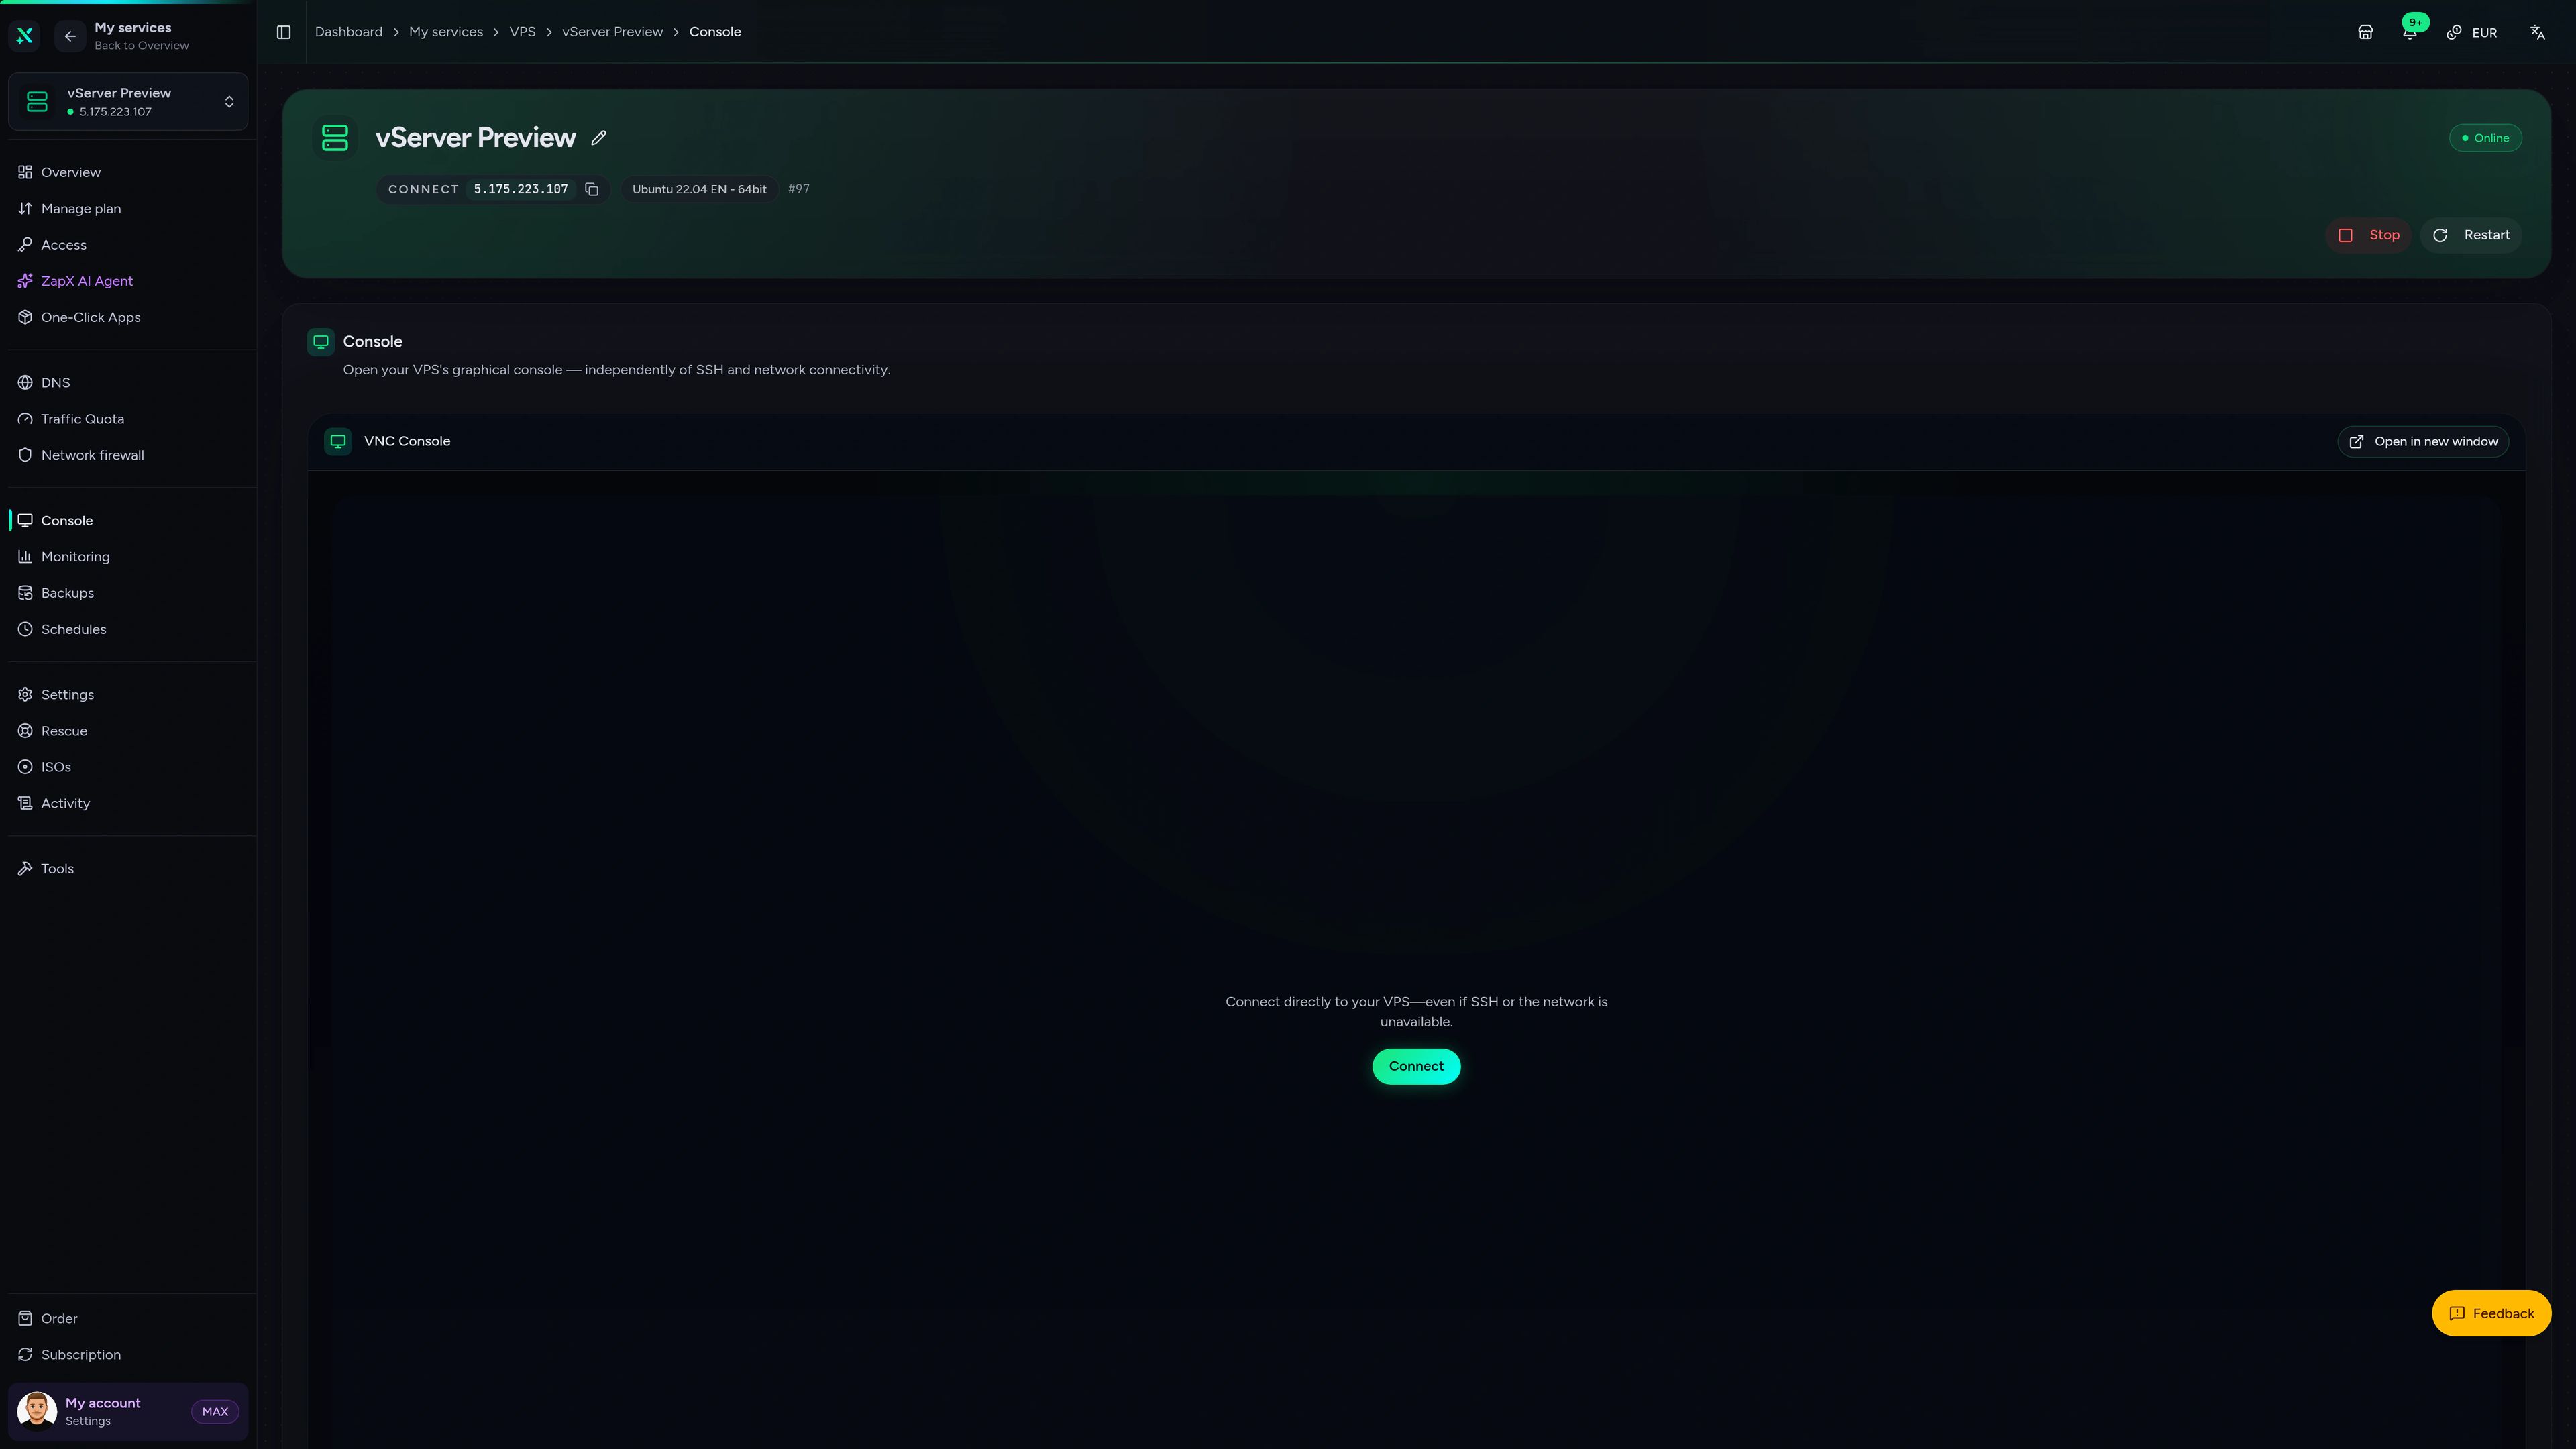
VPS Server – Console
Console of the VPS server in the ZapX customer panel.
The ZapX AI Agent helps with Grafana, PostgreSQL and Coolify questions on your VPS, reads logs with you and suggests safe next steps. You decide what to change.
The ZapX AI Agent is part of ZapX Pass and applies account-wide to every supported service.
View ZapX PassZapX AI Agent
panel.zap-hosting.com
Benchmark
The measured values show how fast your VPS is ready and how much CPU and disk headroom is left for PostgreSQL queries, dashboard refreshes and a Prometheus stack.
High-performance VPS, CPU model depends on the location
Typical VPS plans without a published host CPU
confirmed 2026-07-01
Real workloads
These are the dashboards and alerts people actually run with Grafana and PostgreSQL on their own server, from homelabs to small SaaS teams.
Ready to deploy?
Your Grafana dashboards, on your own VPS.
ZapX mobile appComing soon
Keep an eye on the server behind your Grafana dashboards with the ZapX mobile app, wherever you are.
Also available
WireGuard, Coolify, monitoring, and more — one-click setup on your VPS.

Private Cloud
NextCloud is a self-hosted, open-source platform that provides file storage, collaboration, and communication tools for seamless data management.
Automatic setup

automation
n8n is an extendable workflow automation tool.
Ready in ~2 min

vpn
The easiest way to run WireGuard VPN + Web-based Admin UI.
Ready in ~2 min

media
Plex organizes video, music and photos from personal media libraries and streams them to smart TVs, streaming boxes and mobile devices.
Ready in ~2 min

Password Security
Vaultwarden is a password manager that allows you to securely store and manage your passwords.
No manual configuration

cms
WordPress is open source software you can use to create a beautiful website, blog, or app.
Ready in ~2 min
Also available
WireGuard, Coolify, monitoring, and more — one-click setup on your VPS.
755
Available apps
Benefit
The app marketplace is included with your VPS — no extra charge per installation.
Choose your apps in the configurator and get started in minutes.
Order a VPS, deploy Grafana with PostgreSQL in one click via Coolify and keep dashboards, users and data on a server you control.
No setup. No risk. Online in 60 seconds.
© 2026 ZAP-Hosting GmbH
 Preferred source on Google