
VPS plan
ZAP Spark
€7.29/ 30 days
- 4 GB RAM
- 2 CPU
- 60 GB NVMe
- 1 Gbit/s Uplink
You decide which services we may enable for analytics, personalization, and external content.
We use cookies and similar technologies on our website to personalize content, embed external media, and better understand how individual areas are used.
Necessary cookies
These entries support essential functions such as security, stability, and form processing.
Optional sections
Your data may be processed with your consent or on the basis of legitimate interests. In the cookie settings, you can reject or explicitly allow each optional category.
Some services process personal data in third countries. By consenting, you also agree to this transfer. You can find more information in our Privacy Policy.
You can reopen and change your selection at any time. · 1.0.2
 Open-source time series database
Deploy VictoriaMetrics in 1 click via Coolify, keep root access and pick a location in Europe or America with DDoS protection.
Packages 1–3 of 9
VictoriaMetricsConfigure yourself
No package fits? Choose your CPU, RAM and storage—you only pay for what your project actually needs.
Powerful CPUs
100 Gbit/s host network
Juniper Firewall
DDoS protection
 Visa
 Mastercard
 American Express
 PayPal
 Google Pay
 Apple Pay
 Klarna
 Amazon Pay
What is VictoriaMetrics?
VictoriaMetrics is a fast, open-source time series database that keeps months of Prometheus metrics queryable in Grafana while using little disk space. Send data from Prometheus or vmagent via remote write, query it with PromQL-compatible MetricsQL and catch a slow memory leak before it pages you at night. With VictoriaMetrics hosting at ZAP-Hosting, the database runs on your own KVM VPS and deploys in one click through Coolify.
Because it is your own server, you set the rules: how long data is kept, which agents may write, and who can open vmui or the HTTP API. Root and SSH access let you adjust startup flags, put a reverse proxy with TLS in front, or run Grafana next to it as a second Coolify app. Your metrics stay on infrastructure you control, and changes happen on your schedule instead of a vendor's roadmap.

Features
Query months of data with MetricsQL, watch your scrape targets and route alerts to Alertmanager, all from one VictoriaMetrics instance you run yourself.
Keep metrics from different agents and protocols in one database instead of several.
Fit retention, deduplication and query limits to your own data and disk size.
Answer questions about your systems in seconds with PromQL-compatible queries in vmui.
Spot a dead exporter immediately on the built-in scrape targets view.
Get notified the moment a rule fires, routed through your existing Alertmanager.
See CPU, memory, disk and network trends of all your hosts side by side.
Locations in Europe and America
4 data centers in Europe and America — choose the location closest to your users.

Inside VictoriaMetrics
Query months of metrics with MetricsQL, keep Prometheus data long-term via remote write and route alerts to Alertmanager, all from one lightweight database.
VictoriaMetrics

VictoriaMetrics
MetricsQL Query Editor
Write PromQL or the extended MetricsQL in vmui, pick a time range and run it. Results appear instantly as a table or graph, so checking a hunch about latency or error rates takes seconds instead of building a dashboard first.
Get started now
VictoriaMetrics on your VPS in minutes — no complicated setup.
Backups & snapshots
Snapshots let you roll back quickly. ZapX Pass unlocks Restore, manual Backups, and longer retention for daily Backups.
More control with ZapX Passextra storage, restore, Pass perks, and Lifetime VPS without activity checks
Reviews
Real feedback on support and setup.
FAQ
Answers to the most important questions before you start.
You pay only for the VPS package; the open-source edition of VictoriaMetrics has no license fee. Current package prices load live in the pricing section and in the shop, so you always see the real monthly amount. Packages differ in RAM, CPU cores and NVMe storage, and you can move to a larger one when your series count grows.
Order a VPS, open the Apps tab in your panel and deploy VictoriaMetrics through One-Click Apps, which uses Coolify under the hood. Once the deploy finishes, open vmui with the address and port shown in Coolify, then point Prometheus or vmagent at the remote write endpoint. A manual Docker Compose setup over SSH works too if you prefer. One-Click Apps guide in the Help Center
It depends on your number of active time series, the ingestion rate and how long you keep data. The smallest package is a sensible start for testing, a homelab or a handful of hosts. Watch VictoriaMetrics' own memory and disk metrics; when active series or retention grow, switch to a package with more RAM and storage.
Yes. Many setups keep Prometheus or vmagent as the scraper and send everything to VictoriaMetrics via remote write for long-term storage. It answers PromQL-style queries through MetricsQL, so Grafana connects to it as a regular Prometheus data source. VictoriaMetrics can also scrape targets itself, which replaces a standalone Prometheus in smaller setups.
Yes. Your VictoriaMetrics VPS is a KVM virtual server with full root access. Coolify manages the app container, but you control the whole system: connect via SSH, change startup flags, add a reverse proxy, install exporters or run your own scripts against the HTTP API. Connect via SSH: Help Center guide
With ZapX Pass you can create manual VPS Backups in the panel and restore them when needed. Inside VictoriaMetrics you can also create instant snapshots of the data directory via the HTTP API and copy them off the server, for example with rsync, so you decide exactly what is kept and where. Learn more in the Help Center
ZAP-Hosting runs VPS locations in Europe and America, and you pick one at checkout. Choose the location closest to the hosts you monitor or the team that reads the dashboards. Many North American setups start with Ashburn, Dallas or Los Angeles, while Europe and other regions are just as available. Availability can vary by product and location.
Yes, you can cancel anytime in the panel. You choose the term when ordering, and a cancellation takes effect at the end of the current paid term, so your VictoriaMetrics instance keeps running until then. Export or back up your data before the term ends if you want to keep it.
Any more questions?
Contact SupportZAPX Dashboard
Live statistics and console access for the VPS that runs your VictoriaMetrics instance.
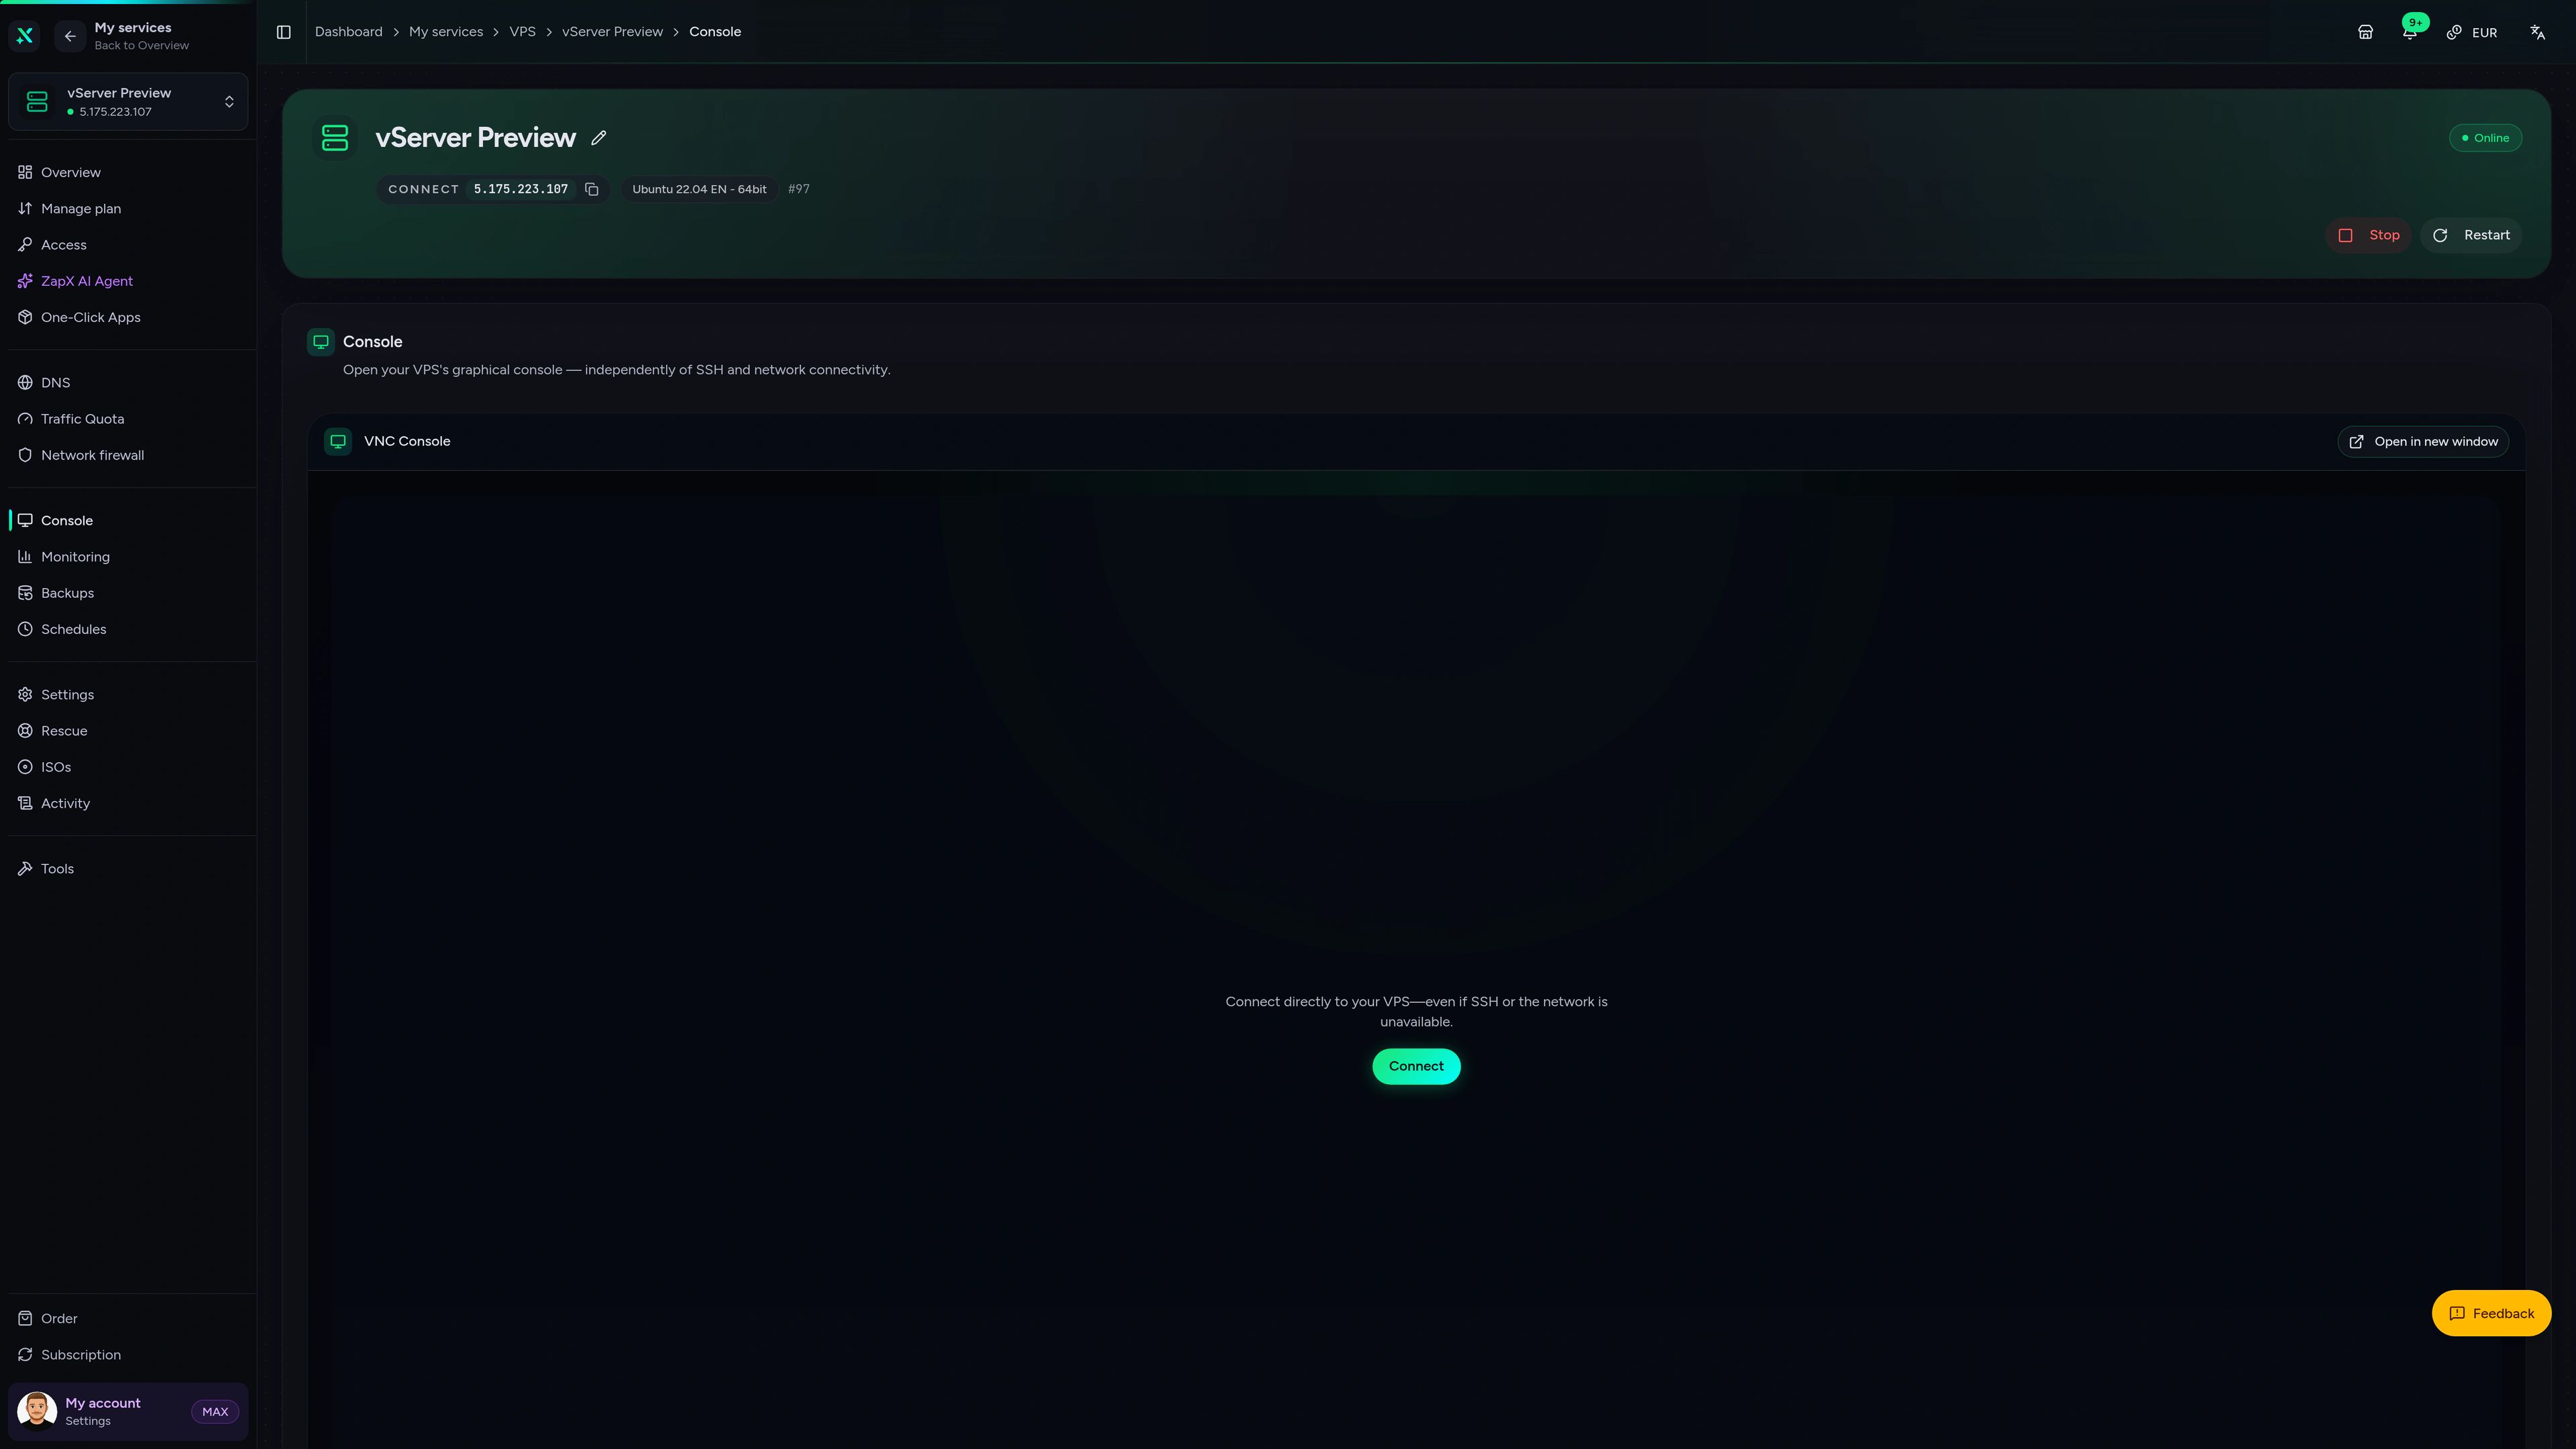
VPS Console tab
VPS Console tab
The ZapX AI Agent explains disk growth, remote write errors or slow queries and suggests what to check next. You stay in control of every change.
The ZapX AI Agent is part of ZapX Pass. It explains problems and suggests next steps, and you decide what runs on your server.
Explore ZapX PassZapX AI Agent
panel.zap-hosting.com
Performance
Measured CPU and disk numbers show how fast your VPS ingests samples and answers long-range Grafana queries without stalling dashboards.
High-performance VPS, CPU model depends on the location
Typical VPS plans without a published host CPU
confirmed 2026-07-01
Use cases
Four real setups where a self-hosted VictoriaMetrics instance pays off, from a single homelab to shared team monitoring.
Ready to deploy?
Your own VictoriaMetrics in one click.
ZapX appComing soon
Check status, restart the server or look at resource usage while you are away from your desk.
Also available
WireGuard, Coolify, monitoring, and more — one-click setup on your VPS.

Private Cloud
NextCloud is a self-hosted, open-source platform that provides file storage, collaboration, and communication tools for seamless data management.
Automatic setup

automation
n8n is an extendable workflow automation tool.
Ready in ~2 min

vpn
The easiest way to run WireGuard VPN + Web-based Admin UI.
Ready in ~2 min

media
Plex organizes video, music and photos from personal media libraries and streams them to smart TVs, streaming boxes and mobile devices.
Ready in ~2 min

Password Security
Vaultwarden is a password manager that allows you to securely store and manage your passwords.
No manual configuration

cms
WordPress is open source software you can use to create a beautiful website, blog, or app.
Ready in ~2 min
Also available
WireGuard, Coolify, monitoring, and more — one-click setup on your VPS.
755
Available apps
Benefit
The app marketplace is included with your VPS — no extra charge per installation.
Choose your apps in the configurator and get started in minutes.
Deploy VictoriaMetrics in one click, connect Prometheus via remote write and open your first Grafana dashboard in minutes.
No setup. No risk. Online in 60 seconds.
© 2026 ZAP-Hosting GmbH
 Preferred source on Google